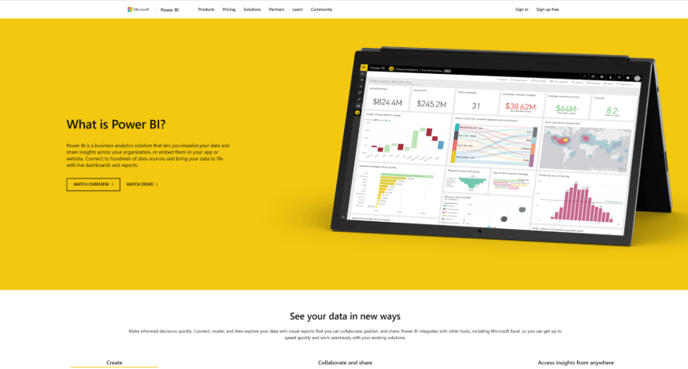
Power BI is a business analytics service provided by Microsoft enabling users to visualize and analyze data from various sources. This article contains everything you need to know when integrating Power BI with Databeat.
Table of contents in this article:
What is PowerBI?
Power BI is a business analytics service provided by Microsoft. It allows users to visualize and analyze data from various sources, including databases, Excel files, web services, and cloud services. With Power BI, users can create interactive reports and dashboards to gain insights into their data and make data-driven decisions.
Key features:
- Data Connectivity: Connects to diverse data sources.
- Data Preparation: Cleans and shapes data efficiently.
- Data Modeling: Builds relationships and calculates measures.
- Visualization: Creates interactive reports with various visualizations.
- Sharing and Collaboration: Securely shares reports and collaborates in real-time.
How to enable Power BI
- Login to DatabeatOMNI with your Microsoft 365 account.
- Ensure you have OMNIplay Pro in the bottom left corner.
- Open Microsoft 365 integration settings from "Locations - Info".

- Enable Power BI.

- Go to users, and enable OMNIBI role.
How to setup PowerBI widget in screen designer?
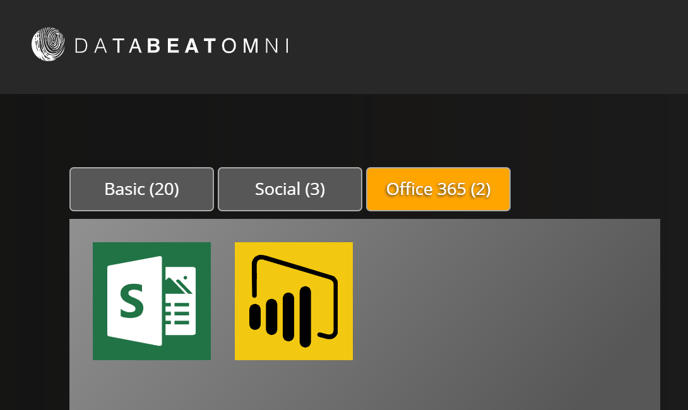
Find "Screen Designer" at the top of the page within DatabeatOMNI. Click on Office 365, then drag and drop the Power BI widget to begin visualizing your data.
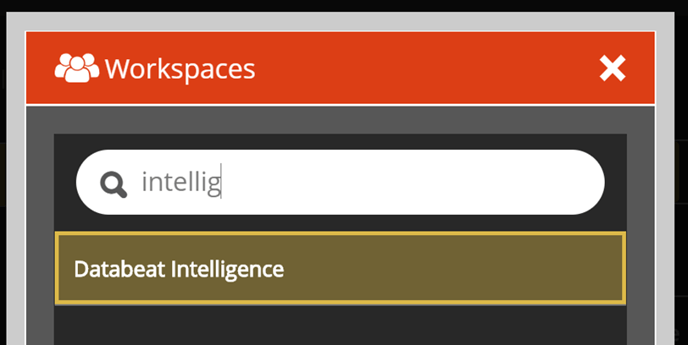
Choose the Office 365 Groups (Power BI Workspaces) that you want to showcase data from.
Choose between Reports or Dashboards to view the available options that have been shared. Decide whether to publish all of them or select specific reports/dashboards. If you wish to publish multiple items, you can adjust the display time to allocate more time for complex or critical information.
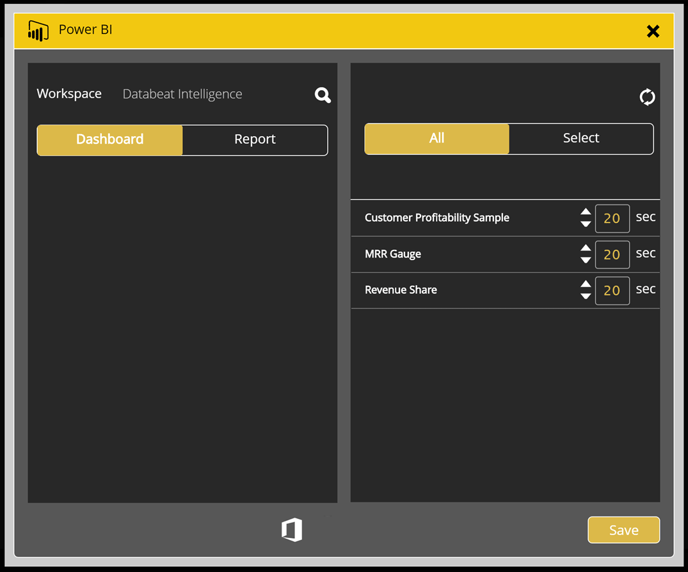
Save your configuration by clicking on the "Save" button in the Power BI widget configurator.
Once you have selected the report or dashboard, it will be displayed on the preview screen in a small placeholder box. You can customize the size of the box according to your preferences.
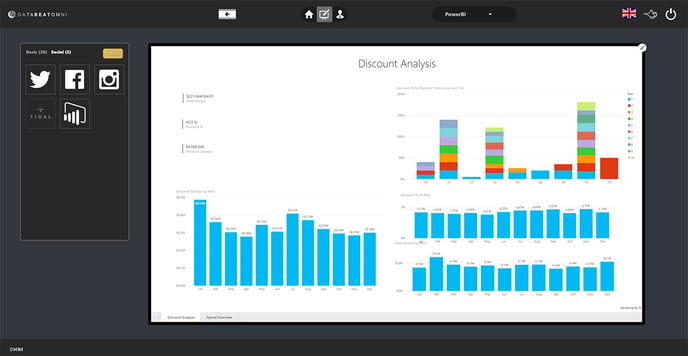
If you want to change the report click on the "settings icon" and change to another report or dashboard of your choosing.
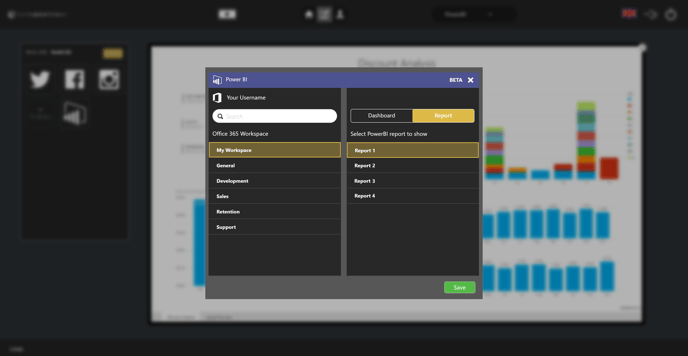
Congratulations! You have now finished setting up your first dashboard or report using the DatabeatOMNI PowerBI widget.
Troubleshoot and FAQ
Browse a list of frequently asked questions and answers about the Power BI widget.

